Vexing VIX: Stevens Students Apply Machine Learning Techniques in Bid to Predict Volatility
Team Hopes Its Work Gives Asset Managers Better Tools to Balance Risk
The volatility swings in February that erased early 2018 market gains took investors for a ride that left them doing a lot of second-guessing.
Meanwhile, a team of seniors in the Quantitative Finance program at Stevens Institute of Technology was in the midst of a project focusing on just that topic. Only instead of fear for their portfolios, they were left wondering if their predictive analytics model could successfully account for the regime changes in the VIX.
The four business students are using machine learning algorithms to create a regression model that can forecast the Volatility Index, or VIX, in the hope of helping financial engineers and data scientists create portfolios that consider VIX risk in asset balancing. The VIX measures the market’s expectation of 30-day volatility; the implied volatilities of a range of index options are calculated in determining the index, which is considered a leading indicator of recession — investors often call it the “fear gauge.”
“We could have looked at predicting a different index, but around time we decided to pursue it, the VIX was at an all-time low, so we thought it was an interesting time to pursue the topic,” said Emily Singleton, who accepted a full-time offer at the quantitative trading firm Jane Street.
“Volatility is something that all major financial firms are trying to predict for myriad potential uses, so there is definitely demand for this type of research in the financial services industry,” said Matt Zimmer, who is already working at Bank of Tokyo-Mitsubishi and will join the bank full time after graduation.
Defining the complexity of financial systems
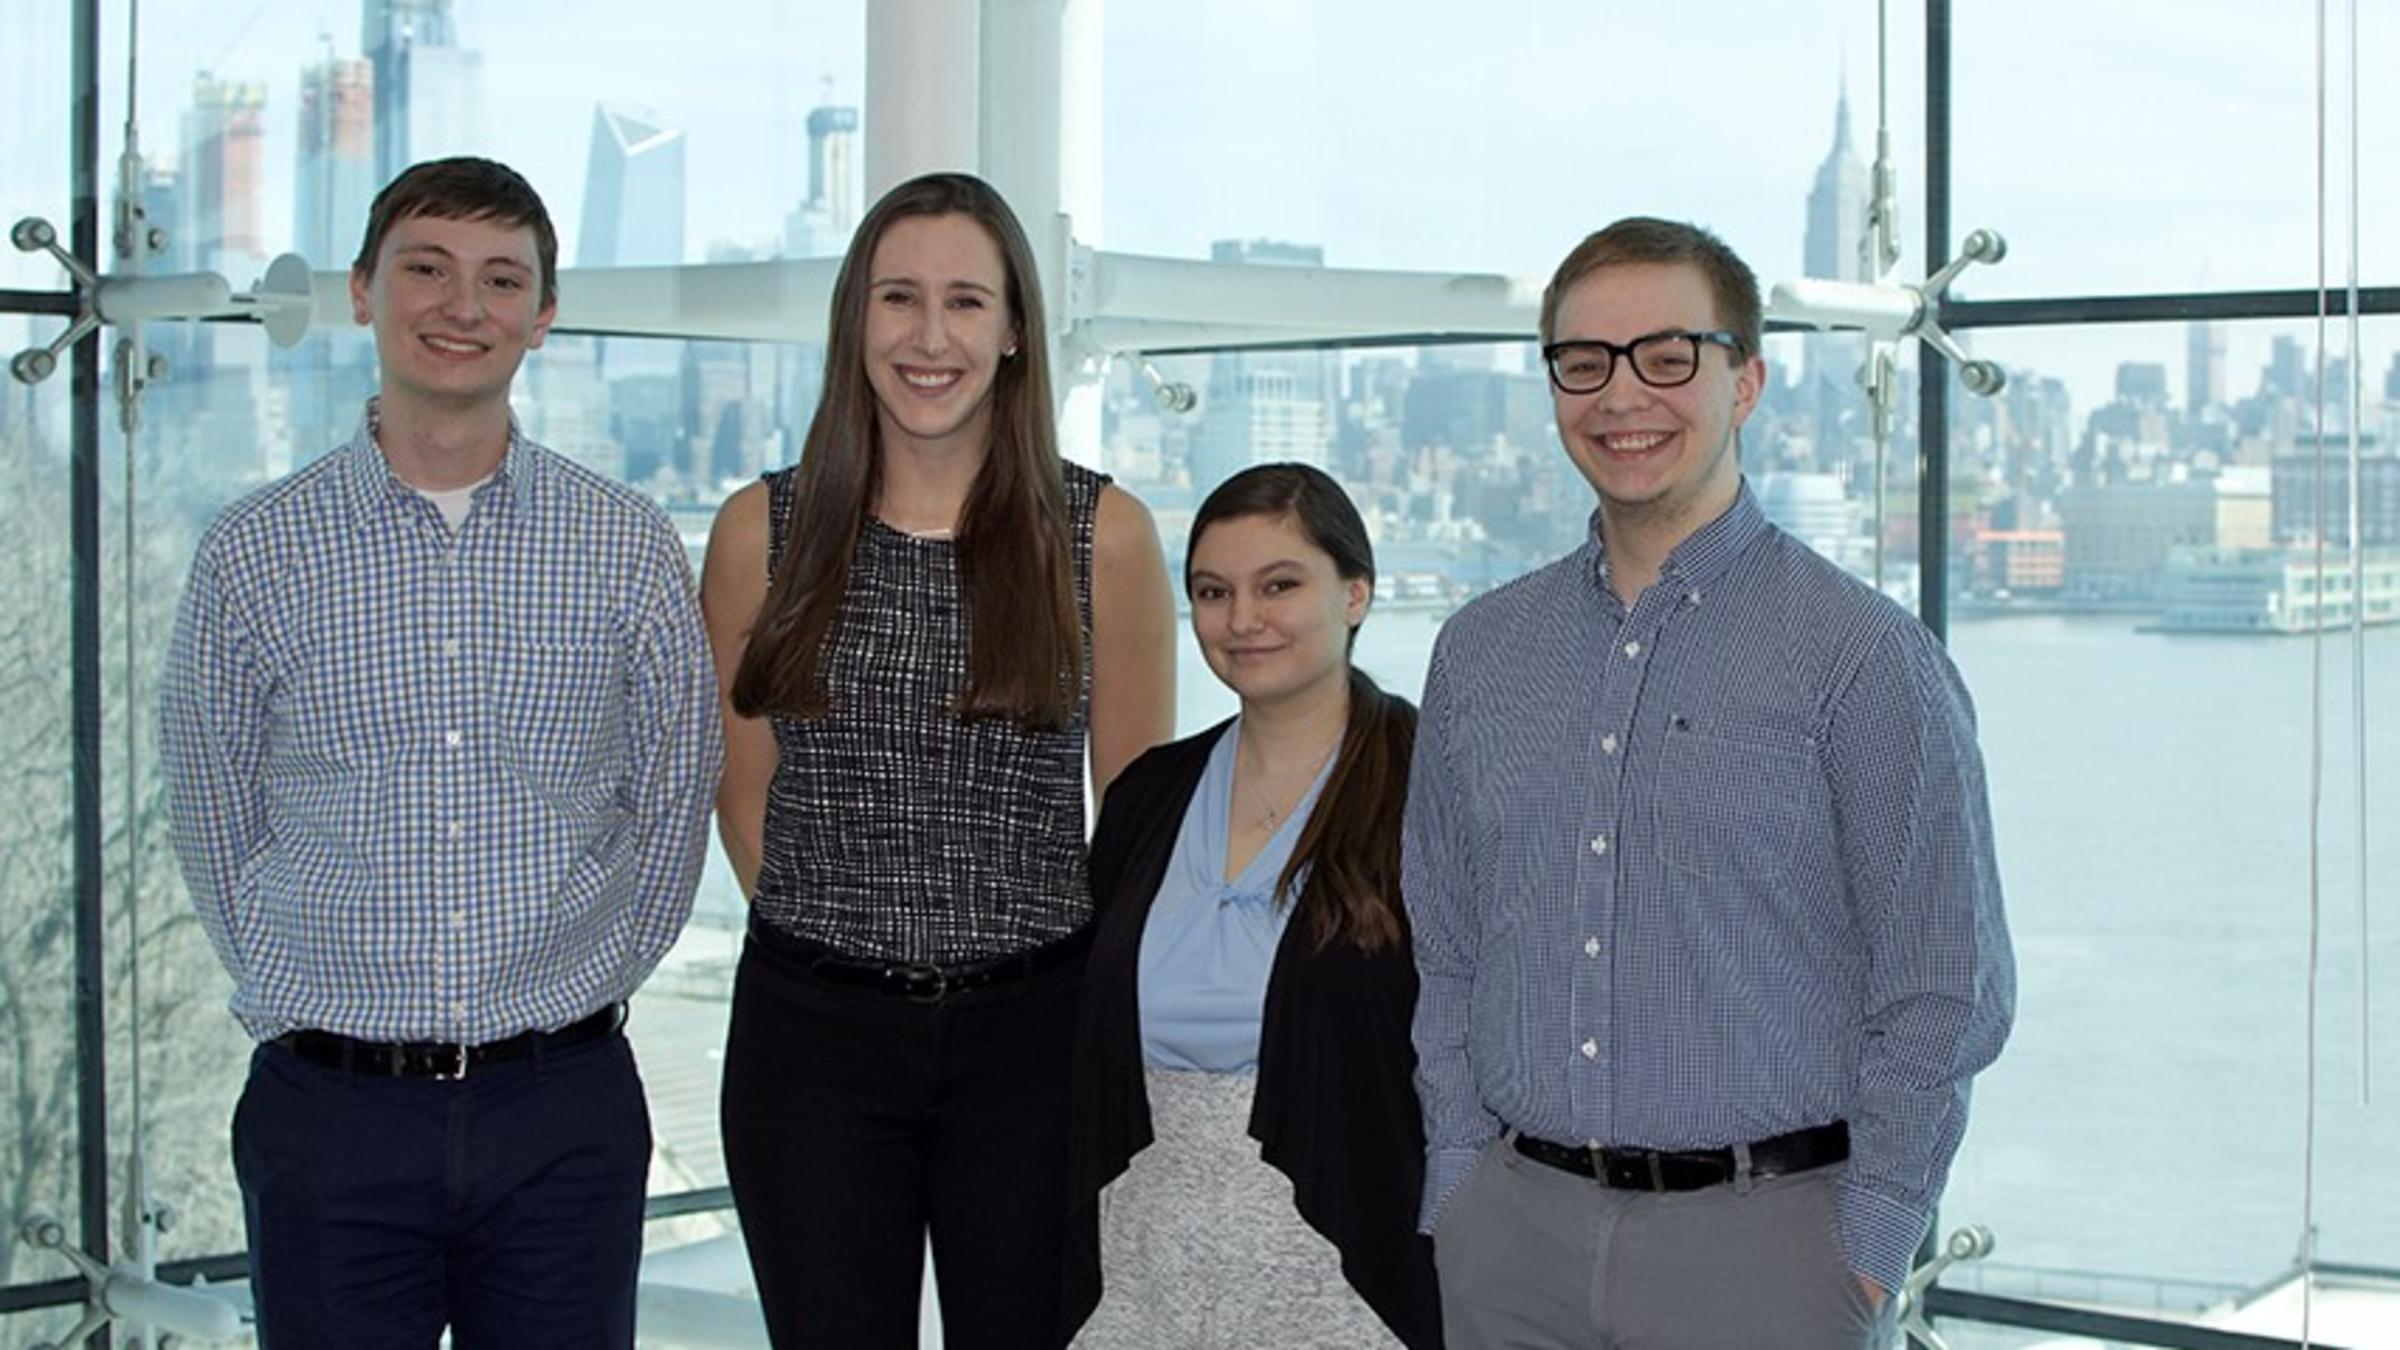
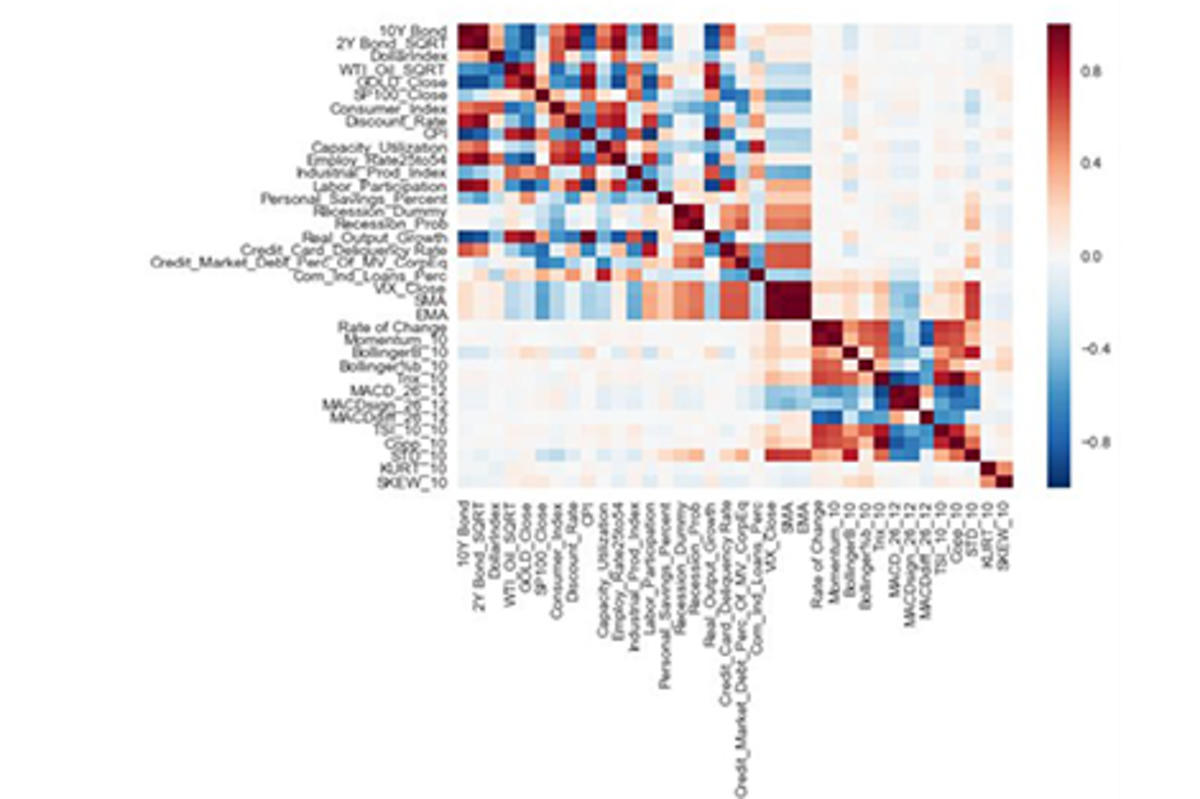
In assessing the market need for their model, the team — which also consists of Maria Frolov and Gordon Oxley — first researched existing scholarship on VIX prediction, hoping to find a unique approach to the problem. As a result of their research, “it became clear that this change in market volatility was due to a diverse variety of factors, and we realized the true complexity of our financial system,” Oxley said.
“We have seen Senior Design projects focusing on the VIX in the past, even one that tried to forecast the index using different types of models,” said Frolov, who will be working in Protiviti’s data and analytics group after graduating; she, Zimmer and Oxley also will receive master’s degrees in Business Intelligence & Analytics at commencement. “I brought some machine learning to my internship at Protiviti, and I am excited to continue to work on similar projects moving forward in my career.”
The project team was advised by Dr. Germán Creamer, who is among the world’s leading experts in machine learning applications in finance, including areas like behavioral finance, forecasting, risk and algorithmic trading; “his introduction to machine learning class is what pushed us to go this route for our project,” Zimmer said.
“He really challenges you to want more for yourself, and he’s always there if you need help or have questions,” Frolov said.
'Significant thought and problem solving' required

Machine learning sometimes is poorly understood as an autonomous black box, “but it requires a lot of data preparation, problem set up and supervision of the algorithm,” said Gordon, who hopes to use such techniques in his career — he accepted an offer in corporate IT with Jefferies.
“Applying machine learning, and analyzing results, requires significant thought and problem solving,” he said. “This has taught me to be extremely analytical in my thinking and very skeptical of results — especially overly positive ones — until I completely understand the mechanics of the components that led to those results.”
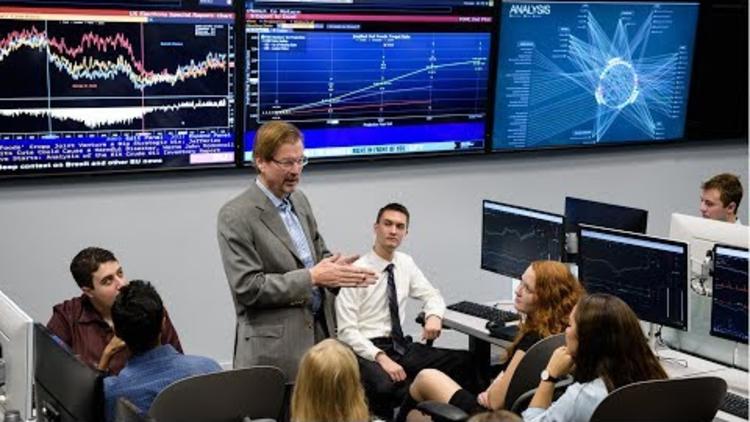
The students made extensive use of the high-end analysis and visualization tools in the Hanlon Financial Systems Center to do their research, and will present their findings in a series of Tableau displays and other graphics at the May 2 Innovation Expo. The center teaches students to use data from Bloomberg, tools like Tableau, and languages like R and Python in thinking critically about technology’s role in the most complex finance problems.
As Singleton put it, “we want to be able to show people our data in a way that makes sense — and doesn’t bore them to tears.”
That’s an important skill in finance, which has become a tech-intensive industry where live market data pours in faster than people can assess it. The ability to analyze and visualize vast amounts of data is highly prized in industry — 100 percent of students graduating from the Quantitative Finance program in 2017 were hired or enrolled in grad school within six months.
“Senior Design is a good window into the corporate world, because you take on a complex project, but then have to figure out how to relate it to anyone walking by your booth,” Singleton said. “That’s a big help for us as we think about how we’ll be working and presenting in the real world.”