Undergraduate Team Tops National Data Competition with Urban Energy Study
Mentored by a Stevens systems professor, the four-member team captures top pitch and second-best paper honors at the Oak Ridge National Laboratory-sponsored data challenge
A talented team of four Stevens undergraduates has brought new perspective to urban energy flows — and received national recognition for doing so.
The team, mentored by School of Systems & Engineering professor Philip Odonkor, placed first and second in award categories of a national data challenge for its comprehensive analysis of relationships and patterns in Chicago's climate, energy usage, building stock and demographics.

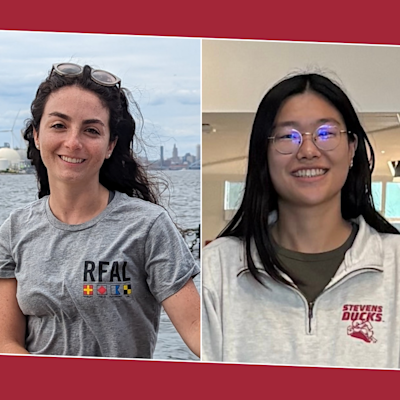
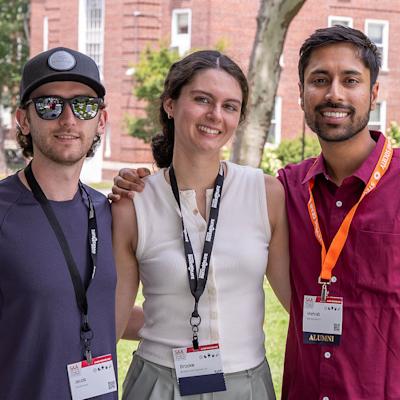
Computer science students Ronald Estevez, Samantha Inneo and John Schneiderhan and industrial and systems engineering student Daniel Wadler were awarded the Best Lightning Talk prize for their two-minute presentation and also secured runner-up honors for top Student Paper at the Smoky Mountains Computational Sciences and Engineering Conference (SMC2020) data challenge competition conducted virtually in August.
More than fifty university teams participated in SMC2020, which was sponsored by the U.S. Department of Energy's Oak Ridge National Laboratory.
"They produced new insights, and a highly professional paper and talk, which is remarkable given how our team spent only three to four weeks on the project — using analysis and visualization tools they had never used before," notes Odonkor.
'Two Chicagos' emerge from data analysis
The four undergraduates, all participants in Stevens' Pinnacle Scholars program, did not know each other when each separately signed on last fall to perform summer research on a project that energy expert Odonkor proposed to analyze energy and weather flows on the Stevens campus. In particular, he had planned to obtain and task the team with analyzing data collected in real time from Stevens' recently constructed Gateway Academic Complex.
But when the COVID-19 pandemic struck in spring, Odonkor was forced to quickly pivot from those plans.
"Suddenly, nobody was on campus, nobody was using energy; buildings were not operating as normal. The data we saw was suddenly very irregular," he says.
That's when he found the Oak Ridge challenge, joining it late but in time to make an entry.
"Starting later than other teams was daunting, but it was also exciting to be in this national conference going up against teams from all over the country," recalls Odonkor.
The undergraduate team began by downloading three raw datasets — describing about one square mile of the downtown Chicago "Loop" business district's building stock, weather station readings and building energy usage — collected and supplied by the national lab.
Next the group set to work analyzing that data in various ways.
We had not analyzed data at anywhere near this scale," says Inneo, the junior who captained the squad. "But it definitely became easier over time as we all became friends, as professor Odonkor guided us, and as we learned to collaborate on Zoom or by sharing screens."
Struggling to do high-load computations on laptops, team member Estevez hit upon the solution of building an SQLite database to process some of the data more quickly.
"I wrote a script that processed the weather data given to us, a large CSV file of 16 values for 880 different locations taken at 15 minute intervals over an entire year," explains Estevez, "then created a local database and uploaded each row of data into it.
"This both reduced the size of the weather dataset — only about half of the data points were within our geographic area of interest — and also allowed us to query the data for particular days' or times' values, as opposed to having to constantly read the entire file."
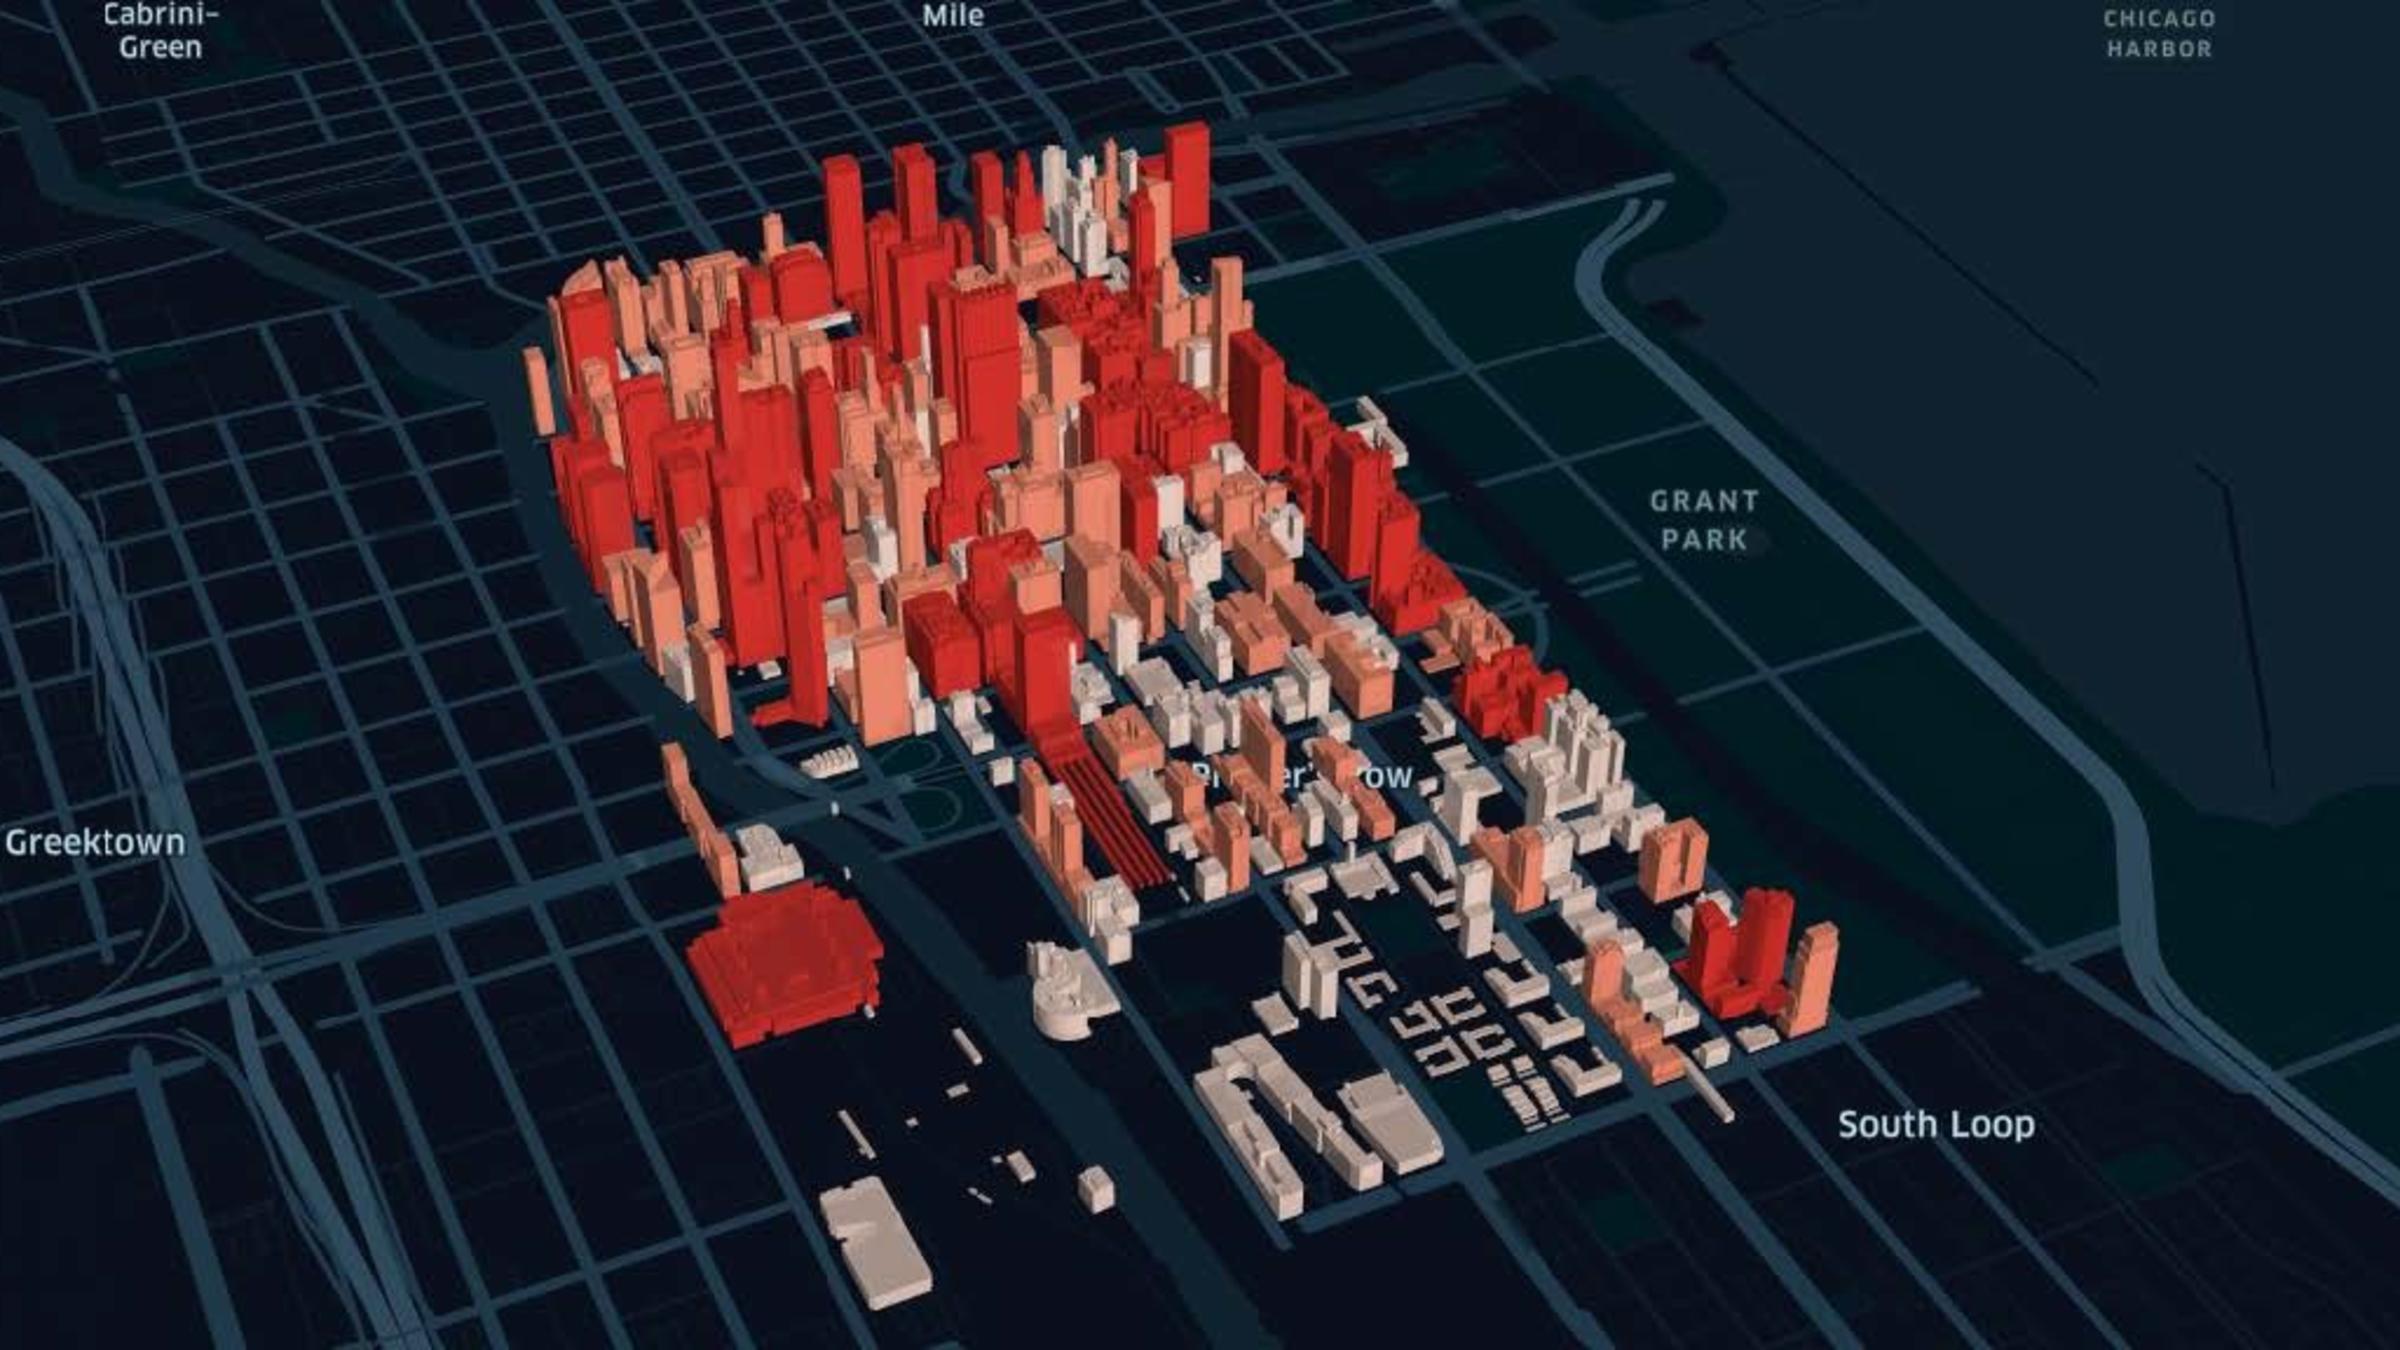
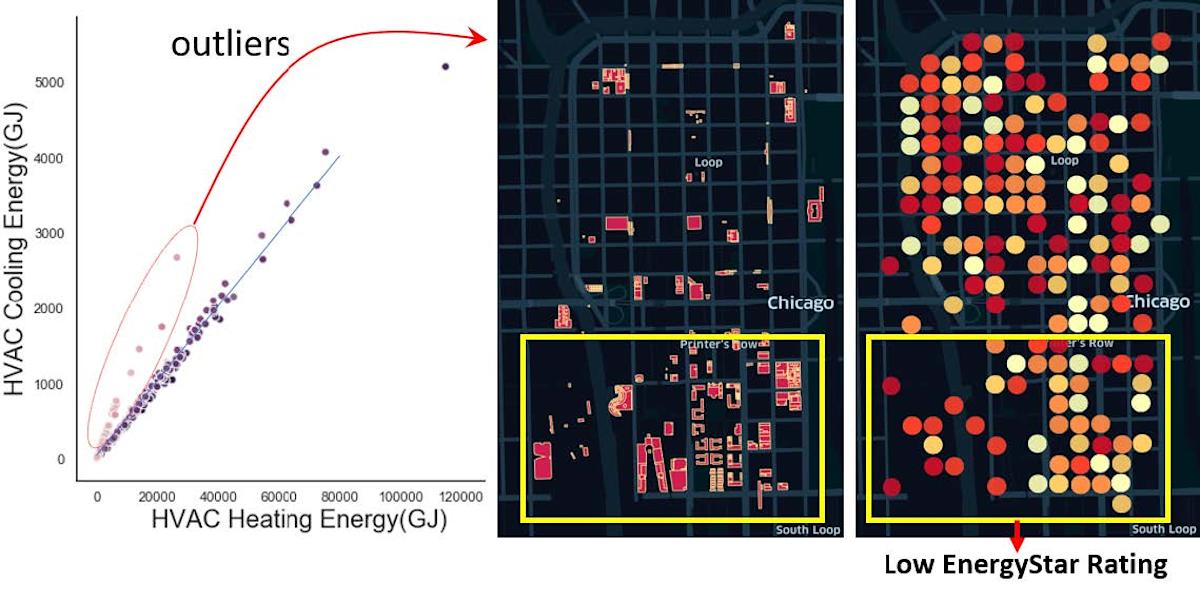
Diving in, they began to detect patterns. Among the team's major conclusions was a novel insight that the northern and southern regions of downtown Chicago differ quite distinctly in building stock, energy usage and energy efficiency, so much so that they constitute what the team calls 'two halves': one consisting of tall, energy-efficient structures, the other consisting of buildings lower in height, less efficient and with different mixes of energy sources.
"We could not find that this insight had been previously published," notes Odonkor.
The team also determined from its analyses that the downtown district experiences discernible microclimates of both temperature and wind gradient that each likely impact local energy usage.
Inneo was chosen to give the two-minute pitch presenting the group's work and conclusions to judges and conference attendees — the talk that ultimately secured the Stevens team top honors in the category.
"The closest I had come to speaking was in high school STEM competitions; this was a very different feel," she recalls. "But I felt I was very well prepared."
During her allotted two minutes, Inneo described the team's goals, approach and methods.
"She was confident, eloquent and to the point, impressing the judges with her command and summary of the great work our team had done," says Odonkor.
The Stevens team also created an impressive set of high-resolution visualizations using Kepler, an open source geospatial toolbox, as well as a motion video of local microclimates. The graphics formed part of the team's second-place presentation, "The Macro Impacts of Micro-Climates on the Energy Consumption of Urban Buildings," which will also be published in the conference's proceedings in October.
The project may continue next year, Odonkor says, either as a deeper analysis of Chicago data or as a form of the originally planned analysis of data collected on the Stevens campus.
Learn more about research in the Department of Computer Science →