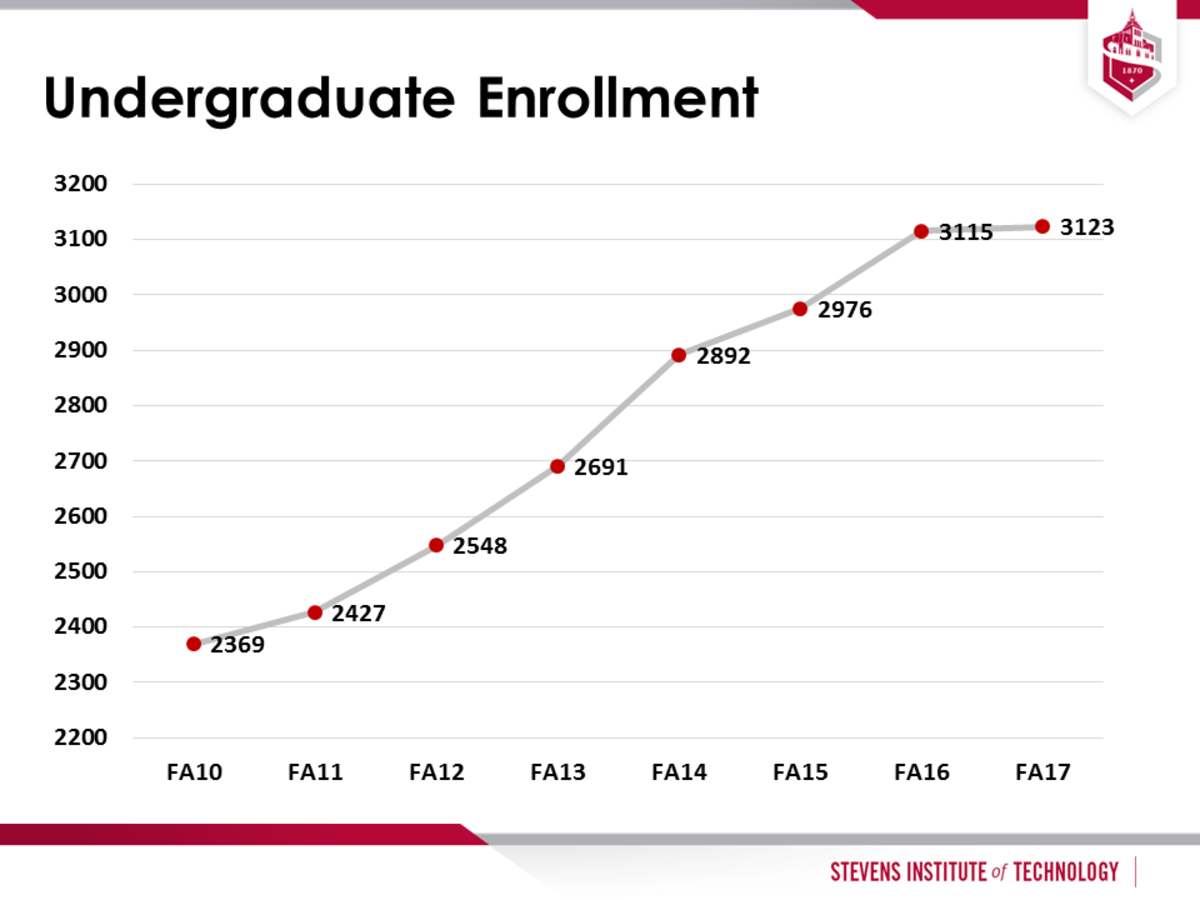
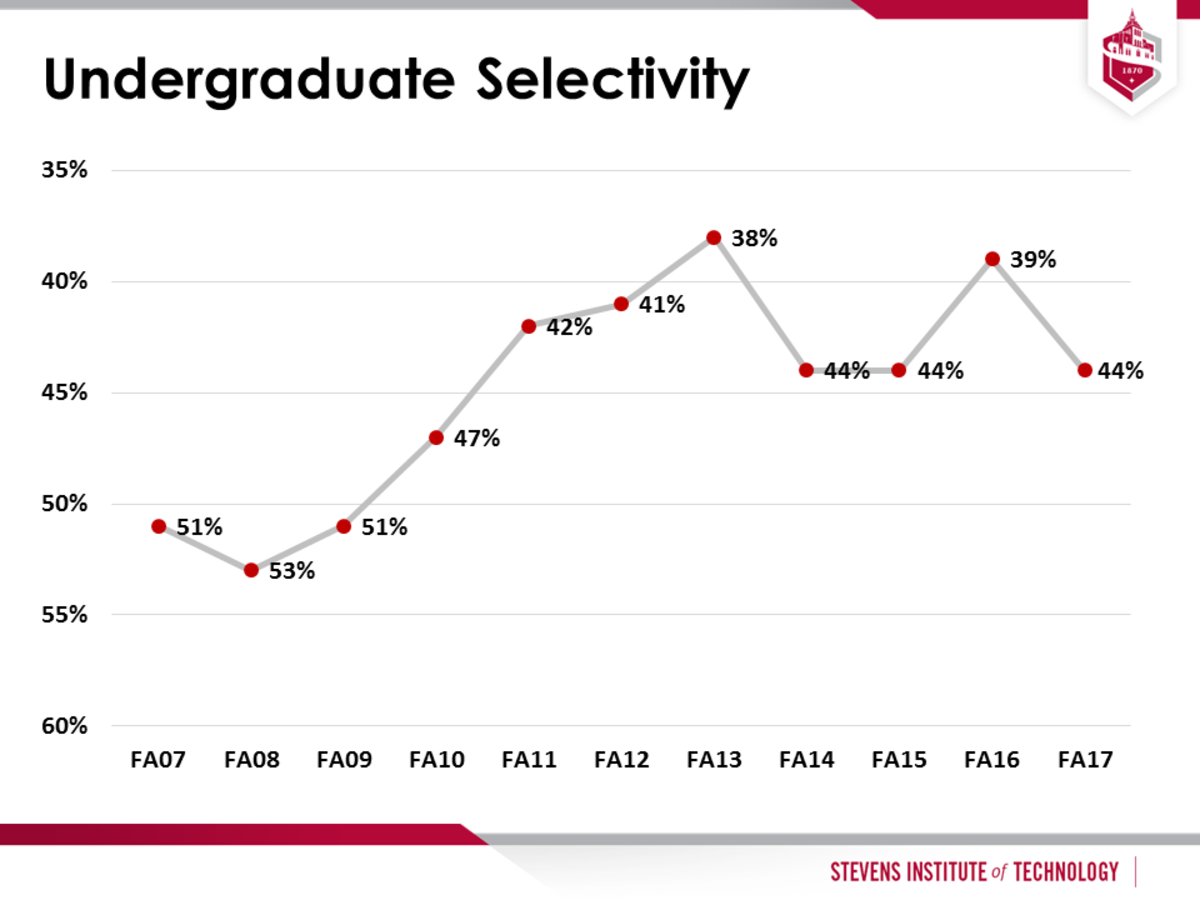
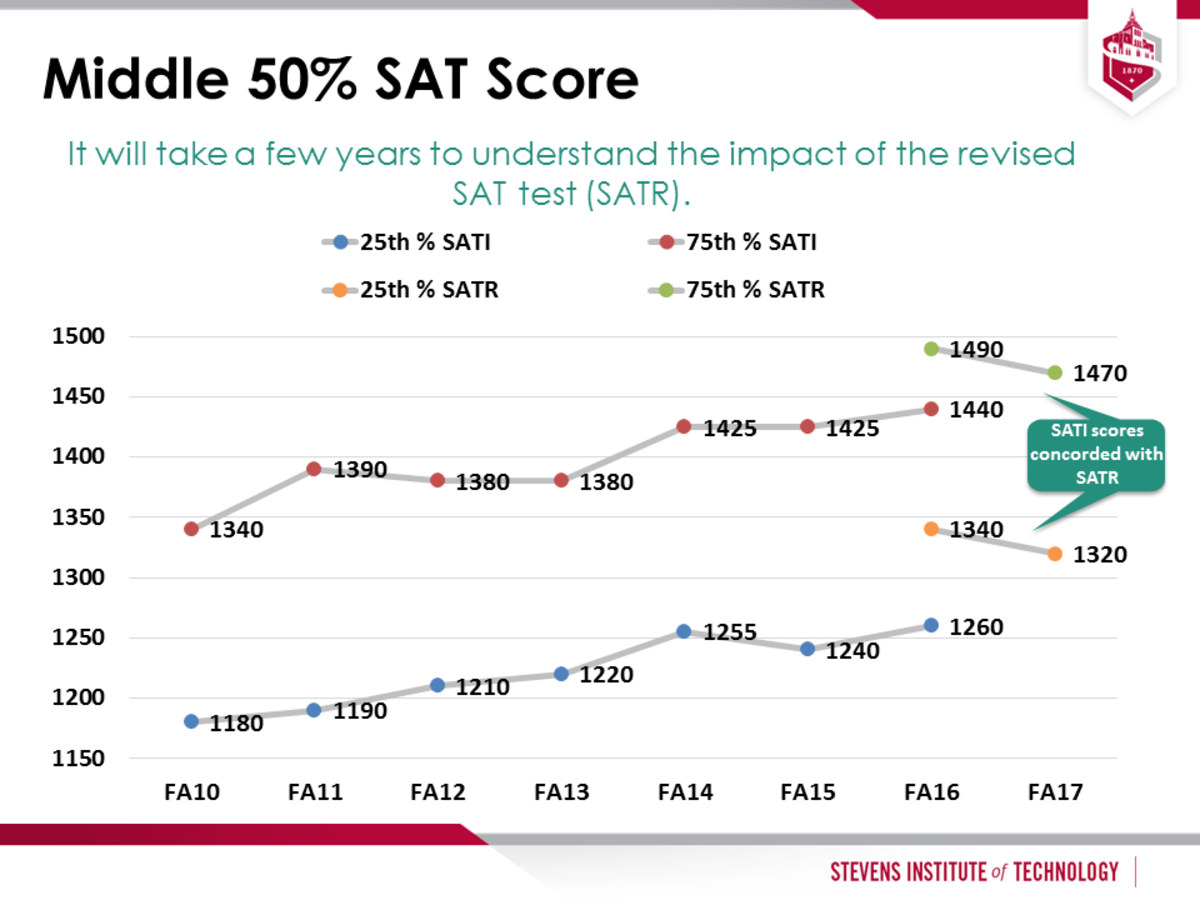
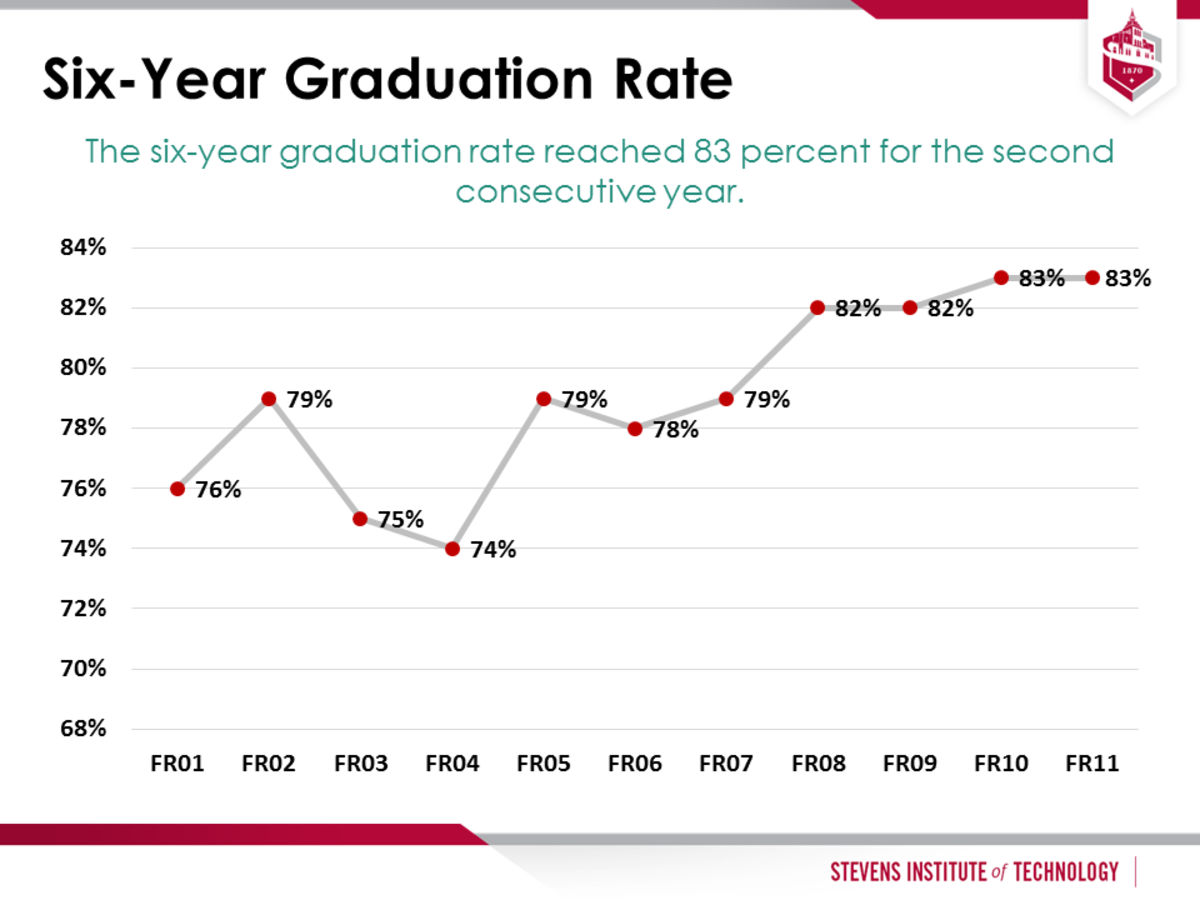
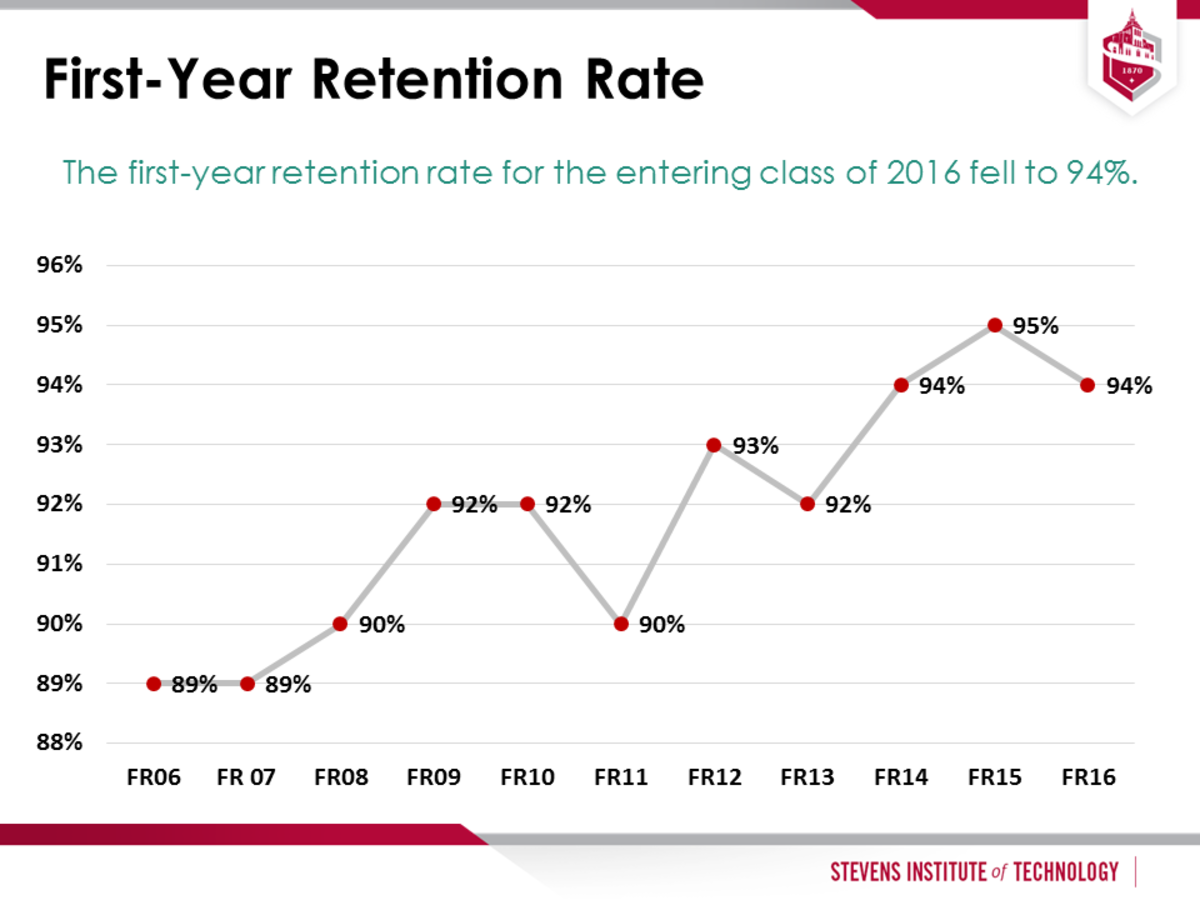
Total undergraduate enrollment increased from 3,115 in Fall 2016 to 3,123 in Fall 2017, exceeding the midpoint goal. Applications increased to 8,335, but selectivity decreased by 5 percentage points to 44 percent from 39 percent in Fall 2016. The middle 50 percent SAT score reached 1320-1470, exceeding the Fall 2017 goal of 1230-1420 for the third consecutive year, although the impact of the revised SAT test (SATR) is unknown. The freshman-to-sophomore retention rate declined by 0.3 percentage points and was rounded down to 94% percent. The six-year graduation rate for the freshman cohort of 2011 remained at 83 percent. The placement rate for 2017 graduates who secured full time employment, were admitted to graduate school or entered the military six months after graduation remained at 96 percent, a record high reached in 2016.
Goal U1:
Stevens will have an undergraduate student enrollment of approximately 4,000 from a baseline of 2,427 in Fall 2011. The intermediate goal is to have an undergraduate enrollment of approximately 3,100 by 2017.
OWNER: VICE PRESIDENT MARYBETH MURPHY
Fall 2017 undergraduate enrollment was 3,123, slightly exceeding the Fall 2016 enrollment target of 3,115. The Fall 2017 undergraduate cohort (freshmen, transfer students, and LINK program participants) was 807 new students against a target of 800. Applications increased to 8,335, a 12.5 percent increase above the final application number of 7,409 in Fall 2016. The percentage of women in the first time full time freshmen class was 29.2 percent, a decrease from 30 percent in Fall 2016, and the percentage of out of state students in the first time full time freshman class was 37 percent, an increase from 34 percent in Fall 2016. The percentage of international students in the first time full time freshman class is 3 percent, down from 5 percent in Fall 2016. The percentage of underrepresented minorities in the first time full time freshman class is 14.6 percent, an increase from 12.8 percent in Fall 2016. First time full time freshman enrollment in the College of Arts and Letters increased from 30 to 47 students, and first time full time freshman enrollment in Business decreased from 112 to 109 students.
Goal U2:
Continue to improve student selectivity and therefore the academic profile of the incoming class. Specifically, the percentage of first-time, full-time undergraduate applicants who are admitted will be 37 percent by 2017 and 33 percent by 2022, from a baseline of 42 percent in 2011. The middle 50 percent SAT score of new freshmen will improve to 1230-1420 by 2017 and 1280-1450 by 2022, from a baseline of 1190-1390 in Fall 2011.
OWNER: VICE PRESIDENT MARYBETH MURPHY
Stevens accepted 44 percent of applicants, compared to 39 percent in Fall 2016. The College Board introduced a revised SAT test (SATR) in 2017 and provided concordance tables to compare the SATR with the old test (SATI). The Fall 2017 middle 50 percent SAT is 1320-1470 (with SATI scores concorded to the SATR). SATI scores for Fall 2016 were 1260-1440, however when concorded to the new SATR, the scores are 1340-1490. Based on guidance from the College Board, it may take a few years of administrations of the SATR to develop reliable correlations between SATI and SATR scores.
Goal U3:
The six-year graduation rate will improve significantly with the goal of achieving at least 83 percent in Fall 2017 (for cohort of Fall 2011) and at least 87 percent in Fall 2022 (for cohort of Fall 2016).
OWNER: PROVOST CHRISTOPHE PIERRE
The six-year graduation rate for the freshman cohort of 2011 was 83 percent, meeting the midpoint goal for the second consecutive year.
The first-year retention rate for the entering class of 2016 (Fall 2016 to Fall 2017) fell by 0.3 percentage points, resulting in a one percent decrease in the first-year retention rate to 94 percent.
Goal U4:
Overhaul the academic schedule and implement curriculum changes with the aim of encouraging and facilitating an array of learning opportunities, including interdisciplinary research and development, critical thinking and problem-solving, community service, K-12 STEM mentoring and international experience (Curriculum ++). In May 2018, 100 percent of undergraduate students will graduate having participated in C++.
OWNER: PROVOST CHRISTOPHE PIERRE
Implementation of the Innovation, Design, and Entrepreneurship at Stevens (IDEaS) program, the creation of living-learning communities, increased participation in international programs and undergraduate research experiences, and significant community service-focused opportunities, including through student organizations, senior design experiences, and the Stevens Venture Center, have contributed to an expanded set of options for students to obtain critical “21st century skills” described in this goal.
Goal U5:
Maintain our stellar placement record for our students and seek to further improve it from our 2011 baseline of 92 percent of students securing post-graduation outcomes as of Nov. 1, 2011.
OWNER: VICE PRESIDENT MARYBETH MURPHY
Post-graduation, 96 percent of the Class of 2017 secured outcomes (employment, graduate, and professional school), achieving success equivalent to the Class of 2016.
A re-designed Career Management Program has been created, providing tiered programming that addresses the varied professional development needs of Stevens graduate students.
A new career management system, Handshake, went live in August 2017. This cutting-edge system uses machine learning to provide a personalized experience and access to a broader range of employment opportunities for Stevens students.
Goal U6:
Stevens will have designed, constructed and staffed a Digital Learning Laboratory (DLL), focusing on the research and practice of technology-enhanced learning across all three schools and CAL (by Fall 2017).
OWNER: PROVOST CHRISTOPHE PIERRE
Efforts toward this goal have been discontinued. View revised goals in the Strategic Plan Midpoint Update.
Goal U7:
A sustained effort consisting of specific initiatives will be undertaken to improve our undergraduate faculty teaching performance and student learning.
OWNER: PROVOST CHRISTOPHE PIERRE
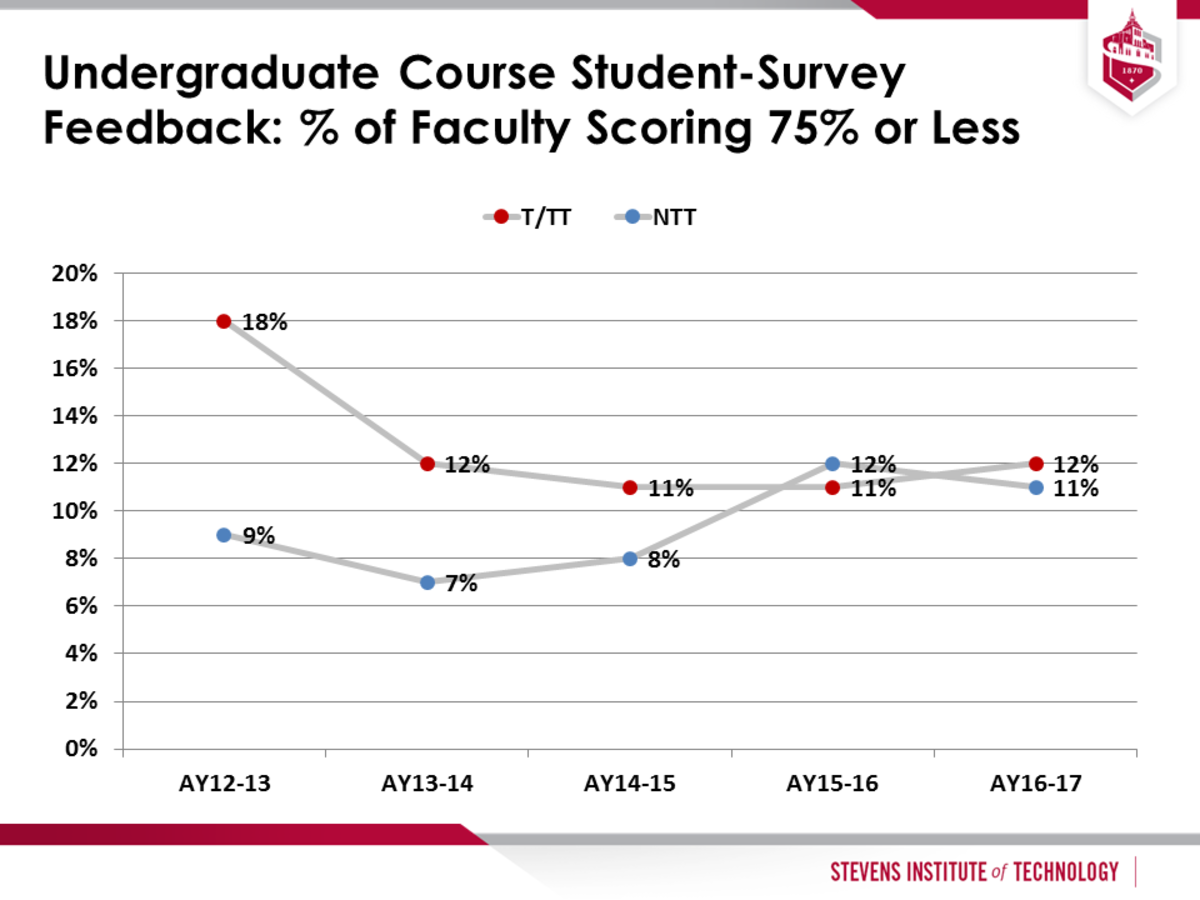
Efforts continued to enhance teaching performance through several initiatives introduced in Year 3 as well as the assessment of teaching based on student feedback obtained through course evaluations each semester. The percentage of tenured (T) and tenure-track (TT) faculty who scored below 75 percent (an average score of 3.0/4.0 or less) reached 12 percent in AY16-17 (vs. 11 percent in AY15-16). The corresponding figure for non-tenure-track (NTT) faculty was 11 percent in AY16-17 (vs. 12 percent in AY15-16).
A number of activities were introduced to proactively identify and mitigate potential issues:
A mid-semester survey template was created and faculty were actively encouraged to seek input from students during the semester. Mid-course surveys provide faculty the ability to obtain student input early on with an opportunity to make adjustments mid-course.
Classroom observations were offered to interested instructors, in collaboration with members of the Teaching Advisory Board. These experienced faculty observe classes at the request of the instructor, with the goal of providing feedback on teaching practices and suggesting ways to improve them, as appropriate. All information stays between the observer and the instructor being observed.
In addition, during AY16-17:
The Center for Faculty Engagement and Advancement organized 12 on-campus workshops focused on improved teaching. These were attended by approximately 50 percent of the full-time faculty population.
Funding was provided to eight faculty members to attend conferences focused on methods and tools for enhancements in teaching and learning. Four faculty attended the Teaching Professor Conference and the other four attended the Teaching Professor Technology Conference. Funded faculty were required to present a seminar at Stevens on a topic of their choosing after the conference.
The Faculty & Staff Professional Development Resources Canvas shell is a resource that faculty frequently use. The table below shows the percent of new faculty who have accessed and fully completed the online modules.
| Student Disabilities Service | Graduate Code of Conduct | College Student Mental Health | Honor Board Instructor Training |
New Faculty Fall 2016 | 42.86% | 61.90% | 47.62% | 52.38% |

